The leaning power of PISA
When I was at university one of our senior lecturers was a widely recognized Coastal Geomorphologist. In other words, he was an expert on coastal landforms. I don’t remember anything he taught but I do remember vividly a story he told – which in itself is food for thought for how we teach Mathematics? The lecturer recounted how he attended a lecturer on rising sea levels. The data collected from a local wharf, said the presenter, showed that the sea level was rising at quite rapid rates. My lecturer, being the thoughtful academic he was, asked the question, “Could the data show that the wharf is sinking?!”
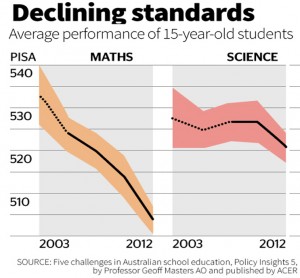
Every three years, international data is released on how well students are scoring in a few key subjects, including Mathematics and Science. The graph below indicates a big drop in these standards for 15 year old students in Australia. Now, of course, the data could also show that scores for other countries have gone up and that, in fact, there is no actual decline in the standards for our Australian students!
An article on the TES website ask, “What if there are “serious problems” with the Pisa data? What if the statistical techniques used to compile it are “utterly wrong” and based on a “profound conceptual error”? Suppose the whole idea of being able to accurately rank such diverse education systems is “meaningless”, “madness”? What if you learned that Pisa’s comparisons are not based on a common test, but on different students answering different questions? And what if switching these questions around leads to huge variations in the all- important Pisa rankings, with the UK finishing anywhere between 14th and 30th and Denmark between fifth and 37th? What if these rankings – that so many reputations and billions of pounds depend on, that have so much impact on students and teachers around the world – are in fact “useless”?”
Yes, this is a clear case of the seriously Leaning Power of Pisa!
