Welcome to H3 Maths

Blog Support for Growing Mathematicians

Machine Learning – More Mathemagic!

March24

“When your bank calls to ask about a suspiciously large purchase made on your credit card at a strange time, it’s unlikely that a kindly member of staff has personally been combing through your account. Instead, it’s more likely that a machine has learned what sort of behaviours to associate with criminal activity – and that it’s spotted something unexpected on your statement. Silently and efficiently, the bank’s computer has been using algorithms to watch over your account for signs of theft.

Monitoring credit cards in this way is an example of “machine learning” – the process by which a computer system, trained on a given set of examples, develops the ability to perform a task flexibly and autonomously. In the case of your bank, the algorithm will have analysed a vast pool of both legitimate and illegitimate transactions to produce an output (“suspected fraud”) from a given input (“high-value order placed at 3 a.m.”).

But machine learning isn’t just used in finance. It’s being applied in many other fields too, from healthcare and transport to the criminal-justice system. Indeed, Ge Wang – a biomedical engineer from the Rensselaer Polytechnic Institute in the US who is one of those pioneering its use in medical imaging – believes that when it comes to machine learning, we’re on the cusp of a revolution.

The inside story

Wang’s research involves taking incomplete data from scans of human patients (the input) and “reconstructing” a real image (the output). Image reconstruction is essentially the inverse of a more common application of machine-learning algorithms, whereby computers are trained to spot and classify existing images. Your smartphone, for example, might use these algorithms to recognize your handwriting, while self-driving cars deploy them to identify vehicles and other potential hazards on the road.

Image reconstruction is not just a medical technique – it’s found in ports and airports, where it allows security staff to use X-rays to peer inside sealed containers. It’s also valuable in the construction and materials industries where 3D ultrasound images can reveal dangerous flaws in structures long before they fail. But for Wang, his goal is to overcome the noise and artefacts that arise when reconstructing a volumetric image of an object (such as a patient’s heart) based on imperfect and incomplete medical-physics data.
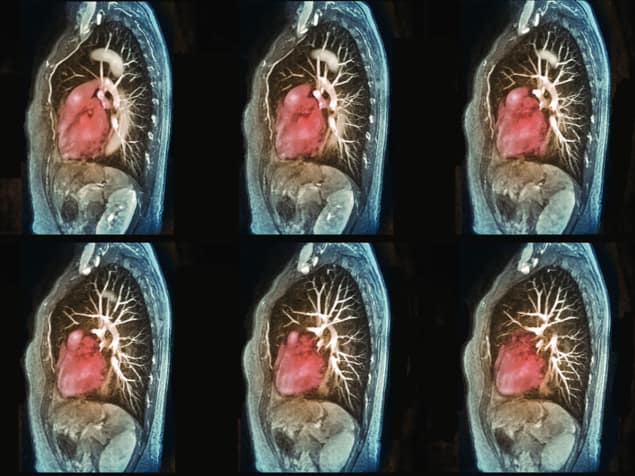
MRI scan

Read the full article at Physics World

by posted under Uncategorized | Comments Off on Machine Learning – More Mathemagic!    

Comments are closed.

Post Support

Largest number between o and 1 million which does not contain the ‘n’ is 88


Rotation SAT Problem: Answer: 4 (see: https://www.youtube.com/watch?v=FUHkTs-Ipfg)


Which number has its letters in alphabetical order? Answer: F O R T Y

Hidden Rabbit? Clue: check the trees

How long for the stadium to fill? 45 minutes.

Where are you? the North Pole

Prize Object Puzzle: If Sue does not know where the prize is in the first question, it can’t be under the square. She must have been told it is under another shape. Apply this same logic to Colin. It is then obvious that the prize cannot be under a yellow object. That helps Sue eliminate her yellow shapes. Got the idea?

Algebra Puzzle: Answer = 1

Popular Math Problems Answers: 1, 1

Number of tabs? According to Lifehacker, the ideal number of tabs you should have open is nine. Yes, a single digit. To some, this is like playing a piano and only using a fraction of the notes!

Worst Graph? Where to start. What a visual mess and even some of the lines merge and are impossible to follow. A graph is a visual display of data, with the goal to identify trends or patterns. This is a spider’s web of information which fails to show a clear pattern at all. Solution? Well, different colors would help, or why not group in two or three graphs where trends are similar?

Number of different nets to make a cube is eleven – see this link

Homework Puzzle; The total value of the counters is 486, so halve this to get 243. Now, arrange the counters to equal this amount twice.

The graph on the left (Coronavirus) is for a time period of 30 days, while the one on the right (SARS) is for 8 months! Very poor graphical comparison and hardly relevant, unless it is attempting to downplay the seriousness of the coronavirus?

10 x 9 x 8 + (7 + 6) x 5 x 4 x (3 + 2) x 1 = 2020

NCEA Level 2 Algebra Problem. Using the information given, the shaded area = 9, that is:
y(y-8) = 9 –> y.y – 8y – 9 =0
–> (y-9)(y+1) = 0, therefore y = 9 (can’t have a distance of – 1 for the other solution for y)
Using the top and bottom of the rectangle,
x = (y-8)(y+2) = (9-8)(9+2) = 11
but, the left side = (x-4) = 11-4 = 7, but rhs = y+? = 9+?, which is greater than the value of the opp. side??
[I think that the left had side was a mistake and should have read (x+4)?]

Archives

H3 Viewers


Skip to toolbar