New Tools to Explain old Newton Equations
 One of history’s great geniuses, Isaac Newton (yes, the mathematician with the curly hair sitting under the apple tree), developed differential equations in the 1600s. But we aren’t all geniuses, so here’s the definition given in Differential Equations for Dummies (caution – this link downloads over 300 pages!) such equations “involve derivatives, which specify how a quantity changes; by solving the differential equation, you get a formula for the quantity itself that doesn’t involve derivatives.”
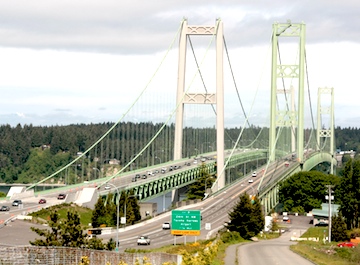
Consider a real-life example that Paul Blanchard (a College of Arts & Sciences professor of mathematics and statistics) : the 1940 collapse of the Tacoma Narrows Bridge, which swayed in high winds before plunging into Puget Sound. “Galloping Gertie,” the bridge that oscillated dramatically in the wind before collapsing in 1940, makes for fascinating footage, but what does it have to do with math? Before we answer that question, have a look at footage taken of this remarkable event.
In the past, the undulating bridge had been used as an example of a linear harmonic oscillator equation — until recent research indicated that it doesn’t make an accurate model of the movement of a suspension bridge. So Blanchard and his students look into alternative types of differential equations to explain the disaster. They sought differential equations to explain the destructive rocking of a suspension bridge that was nicknamed “Galloping Gertie” for its wind-tossed motion. (read more here).
This attention-grabbing instruction won him a Mathematical Association of America teaching award in 2001. Now, his work codeveloping software called DETools to better teach differential equations has earned him the second annual Gerald and Deanne Gitner Family Award for Innnovation in Teaching with Technology.
Since Newton’s time, no genius had much improved the age-old way to solve what’s called an ordinary differential equation.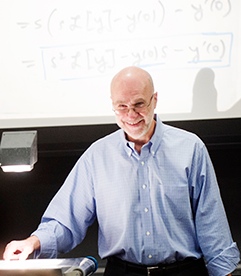 That is, until Paul Blanchard arrived!
Blanchard (right) studies dynamic mathematical systems (systems that change over time). He applied that expertise to differential equations. Now, DETools visually depicts solutions to differential equations rather than just coming up with formulas. Blanchard found a new way to look at old Newtonian methods! (Read the full article here).
(H3 Note: we have been over the new Tacoma Narrows Bridge – below – and it is much safer than the old one!)