Rubik’s Cube answer = 43 Quintillion
Largest number between o and 1 million which does not contain the ‘n’ is 88
Rotation SAT Problem: Answer: 4 (see: https://www.youtube.com/watch?v=FUHkTs-Ipfg)
Which number has its letters in alphabetical order? Answer: F O R T Y
Hidden Rabbit? Clue: check the trees
How long for the stadium to fill? 45 minutes.
Where are you? the North Pole
Prize Object Puzzle: If Sue does not know where the prize is in the first question, it can’t be under the square. She must have been told it is under another shape. Apply this same logic to Colin. It is then obvious that the prize cannot be under a yellow object. That helps Sue eliminate her yellow shapes. Got the idea?
Algebra Puzzle: Answer = 1
Popular Math Problems Answers: 1, 1
Number of tabs? According to Lifehacker, the ideal number of tabs you should have open is nine. Yes, a single digit. To some, this is like playing a piano and only using a fraction of the notes!
Worst Graph? Where to start. What a visual mess and even some of the lines merge and are impossible to follow. A graph is a visual display of data, with the goal to identify trends or patterns. This is a spider’s web of information which fails to show a clear pattern at all. Solution? Well, different colors would help, or why not group in two or three graphs where trends are similar?
Number of different nets to make a cube is eleven – see this link
Homework Puzzle; The total value of the counters is 486, so halve this to get 243. Now, arrange the counters to equal this amount twice.
The graph on the left (Coronavirus) is for a time period of 30 days, while the one on the right (SARS) is for 8 months! Very poor graphical comparison and hardly relevant, unless it is attempting to downplay the seriousness of the coronavirus?
10 x 9 x 8 + (7 + 6) x 5 x 4 x (3 + 2) x 1 = 2020
NCEA Level 2 Algebra Problem. Using the information given, the shaded area = 9, that is:
y(y-8) = 9 –> y.y – 8y – 9 =0
–> (y-9)(y+1) = 0, therefore y = 9 (can’t have a distance of – 1 for the other solution for y)
Using the top and bottom of the rectangle,
x = (y-8)(y+2) = (9-8)(9+2) = 11
but, the left side = (x-4) = 11-4 = 7, but rhs = y+? = 9+?, which is greater than the value of the opp. side??
[I think that the left had side was a mistake and should have read (x+4)?]
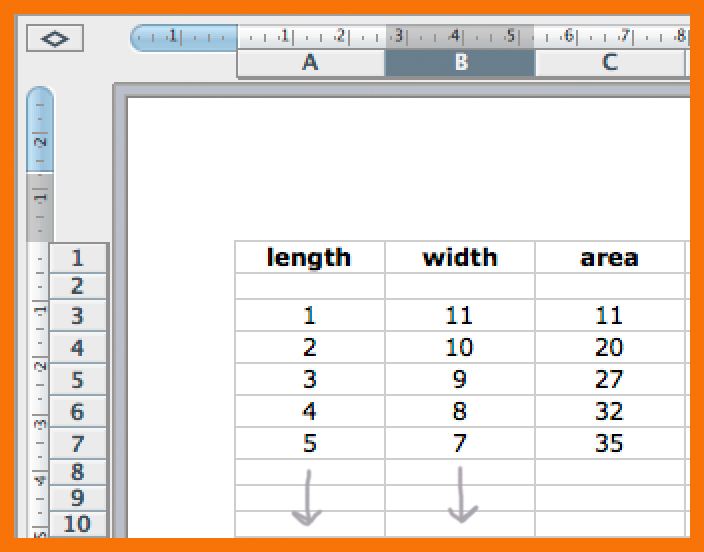
 ‘Sadie’ is such a lovely dog – playful, cuddly and, well, just cute! But, your parents are going out to buy 24 meters of fencing to make a pen for dear Sadie. What will you do while they are out shopping? Why, play with Sadie of course? No, no, no – you have to put your math skills to use and work out the maximum size that Sadie’s pen can be made using the 24 meters of fencing. But, being the helpful parents they are, they have suggested that you use an Excel spreadsheet to find out the maximum area using different lengths and widths for the pen. A snapshot of the spreadsheet is set up for you and one attached for you to complete. The solution will be posted in the ‘Post Support’ shortly, or you can comment back to this post. Good luck!